Overpay Your Mortgage or Invest? The Numbers Explained
i4sys:mortgage-overpay-aggressive
Verdict
With a mortgage rate of 5.5% and an expected return of 8.5%, investing has the edge over the long run.
Confidence: High
Break point: This verdict holds while expected returns remain above your mortgage rate and your horizon stays at least 10 years.
The rate decision
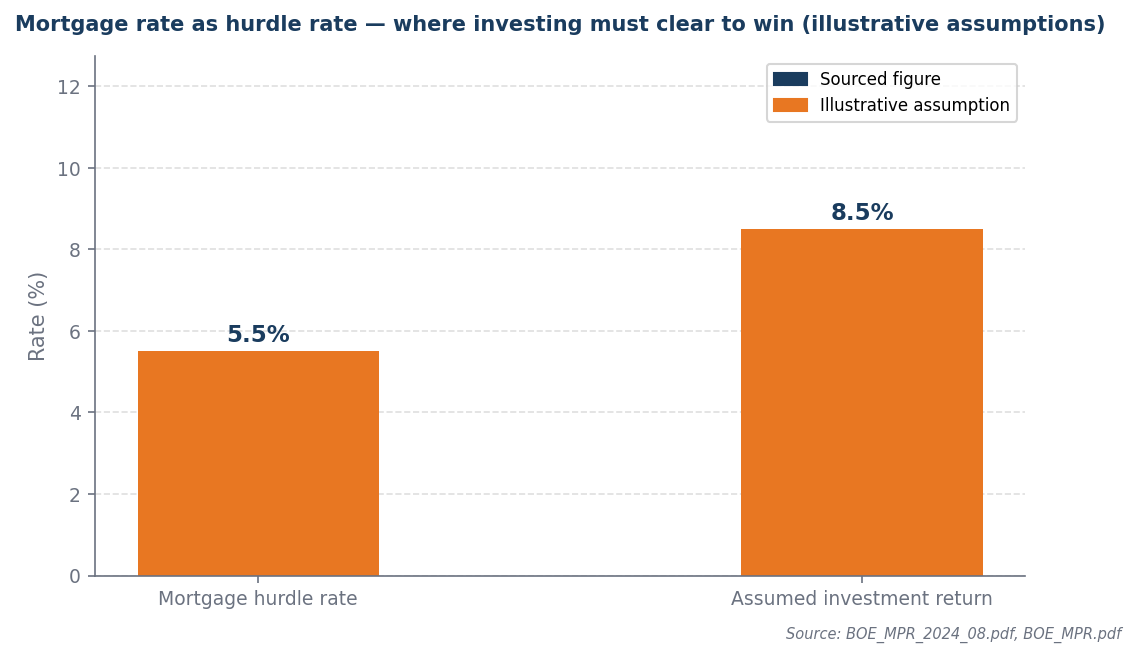
Overpaying only loses if after-tax returns clear the mortgage hurdle by enough to justify volatility.
Borrowers with strong cash flow and long investment horizons can effectively absorb refinancing pressure at 5.5% because their stable income allows them to manage higher interest payments without jeopardizing their financial health. This consistent cash flow enables them to allocate surplus funds toward investments, capitalizing on potential growth opportunities that can outpace the cost of refinancing. Investing becomes viable only when cash flow is secure and the time frame is extended, as it mitigates the risks associated with market volatility and interest rate fluctuations. Thus, these borrowers can strategically leverage their financial position to enhance long-term wealth while comfortably managing refinancing challenges.
The rate backdrop
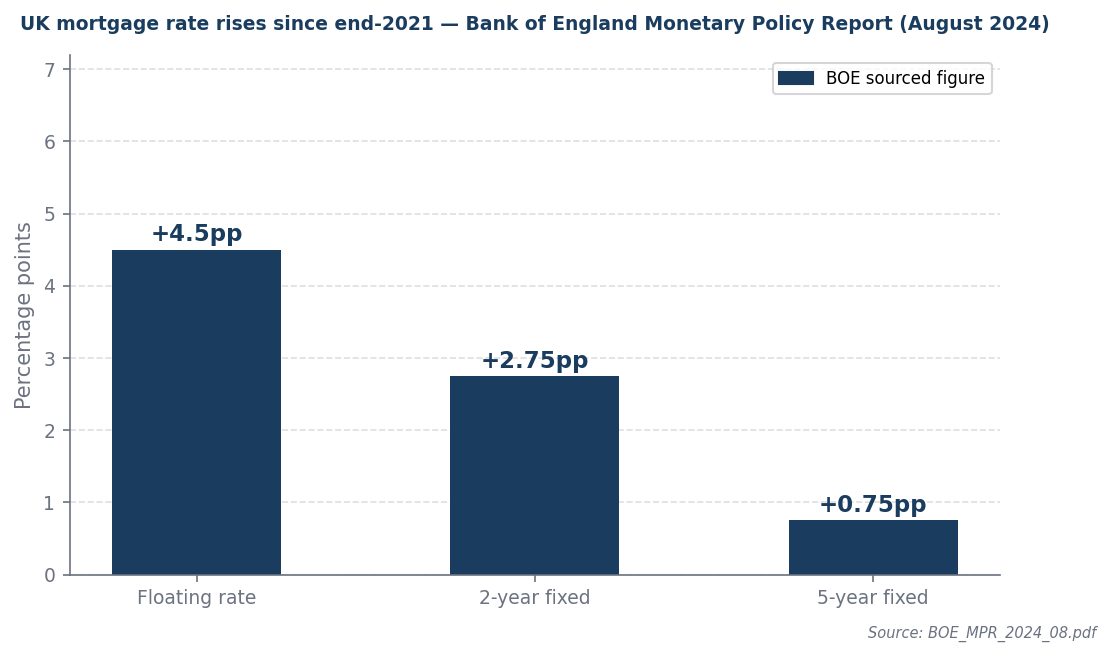
Rate rises since 2021 mean the case for overpaying is materially stronger than it was when mortgage costs were ultra-low.
Since 2021, the Bank of England's rate rises have significantly impacted UK mortgage borrowers, with floating rates increasing by 4.5 percentage points, 2-year fixed rates by 2.75 percentage points, and 5-year fixed rates by 0.75 percentage points, leading to higher monthly repayments and increased borrowing costs. Despite these elevated rates, borrowers with long-term horizons may still prefer investing due to the potential for capital appreciation and the ability to lock in fixed rates that could be lower than future rates, thus mitigating the risk of further increases. Additionally, the long-term investment horizon allows borrowers to ride out short-term volatility, potentially benefiting from market recoveries and compounding returns over time.
Worked example
Assumptions (illustrative): £200,000 mortgage · 5.5% mortgage rate · £1,000/month spare · 8.5% assumed investment return
| Year | Overpay saving | Invest profit | Who is ahead |
|---|---|---|---|
| Year 1 | £330 | £479 | invest profit ahead by £149 |
| Year 2 | £1,320 | £2,060 | invest profit ahead by £740 |
| Year 3 | £2,970 | £4,843 | invest profit ahead by £1,873 |
| Year 4 | £5,280 | £8,931 | invest profit ahead by £3,651 |
| Year 5 | £8,250 | £14,442 | invest profit ahead by £6,192 |
| Year 6 | £11,880 | £21,501 | invest profit ahead by £9,621 |
| Year 7 | £16,170 | £30,245 | invest profit ahead by £14,075 |
| Year 8 | £21,120 | £40,821 | invest profit ahead by £19,701 |
| Year 9 | £26,730 | £53,394 | invest profit ahead by £26,664 |
| Year 10 | £33,000 | £68,138 | invest profit ahead by £35,138 |
By year 10, investment profit (£68,138) exceeds the overpayment saving (£33,000) by £35,138 — but only if the 8.5% return assumption holds without major drawdowns.
This comparison flips if the investment return assumption falls below 5.5% or the mortgage rate rises materially. It also flips if the investment horizon shortens below 10 years.
When this flips
This flips only when returns must exceed 6.5%. The minimum horizon constraint is 10 years.
What to do next
| Your situation | Action | Why |
|---|---|---|
| Return materially above mortgage rate | Invest first | A 3pp+ edge over 10 years compounds to a significant wealth gap |
| Rate above expected return | Overpay first | The hurdle is not cleared — overpaying is the stronger move |
| Uncertain income | Preserve liquidity | Neither path works without a 6-month cash buffer in place |
| Mixed case | Invest majority, overpay remainder | Capture long-run compounding while reducing rate exposure |
Sources and provenance
- Bank of England Monetary Policy Report (August 2024)
- Bank of England Monetary Policy Report (November 2024)
Data as of: 2026-03-26